![]()
![]()
![]()
![]()
|
|
|
|
|
The lead time picture report is useful for the master scheduler to view the accumulated lead times for the items in a product. Report Information.
Select the “Lead Time Picture” link under the “DP Reports”.
The “Lead Time Picture” page appears.
Enter the following field in the “Report Filters” group box:
|
From Item Code |
The starting code in the range of item codes for which the lead time details is to be viewed. You can also enter the code in full or specify it partially using the “*” character. The system retrieves all the codes that are similar to the value entered here. |
|
To Item Code |
The ending code in the range of item codes for which the lead time details is to be viewed. You can enter the code in full or specify it partially using the “*” character. The system retrieves all the codes that are similar to the value entered here. |
|
Plant |
Use the drop-down list box to select valid plants where the items are identified. The system retrieves the warehouse organization units. The system displays the first value by default on launch of the page. |
|
No. Of Levels |
Use the drop-down list box to select the level in the product structure till which the lead time details is to be displayed. You can select from “All” or “Single”. The system displays “Single” by default on launch of the page. The options available are: |
|
|
|
|
|
Lead Time |
Use the drop-down list box to select the lead time for the item depending on the item source. You can select from either “Manufacturing” or “Cumulative”. The system displays “Manufacturing” by default on launch of the page. The options available are: |
|
|
|
|
|
Warehouse Code |
The code or the number identifying the warehouse in which the item is identified. If “Warehouse” is not specified then the standard warehouse for the selected plant is considered. |
Click the “Generate Report” pushbutton to view the accumulated lead time for the selected item in the product.
The system generates and displays the report based on the following conditions:
If "From Item Code" and "To Item Code" are not specified then none of the details are retrieved.
If only "From Item Code" is specified then all the items greater than or equal to the specified item for the selected warehouse are considered.
If only "To Item Code" is specified then all the items less than or equal to the specified item for the selected warehouse are considered.
![]()
Lead Time Picture – An Overview
This report serves as a quick guide to the mater scheduler to identify the critical items, which could affect a change to the Master Production Schedule (MPS). For example, if the master scheduler is investigating a change to the MPS eight weeks in the future, then the scheduler could use the lead time picture to pick off the items that may be a problem in the proposed change. This indicates the items that have accumulated lead time greater than eight weeks.
This page allows you to set the criteria to generate a lead time picture for a set of items. You can generate a lead time picture for a specific item or for a range of items. The plant and warehouse where the items are identified can also be set as a part of the criteria. The number of levels with “Single” or “All” options can be chosen to view a single level bill of material or bill of material considering all the levels. You can also select the lead time options “Manufacturing” or “Cumulative” in the search criteria. If the “Manufacturing” option is selected, only items with source as “Manufacturing” are displayed. If the “Cumulative” option is selected, then the items with the source as purchase or sub contract are also considered.
This page allows you to generate a detail lead time picture that would give you the picture of the accumulated lead times. The system retrieves and displays the components along with the lead time for the selected end item. The accumulated lead time is calculated at a particular level by cumulating the lead times “till” that level. Consider the example give below:
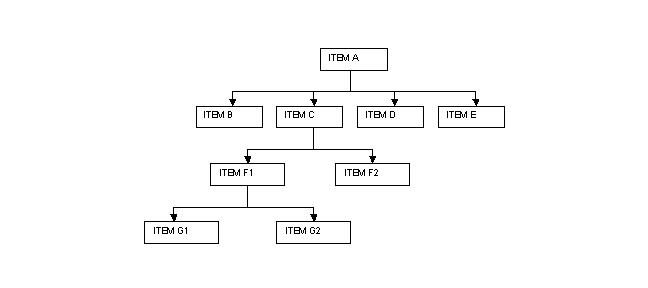
The lead time picture for the parent ITEM A is as follows:
|
Components |
Lead Time(days) |
Accumulated Lead Time(days) |
|
-ITEM B |
5 |
5 |
|
-ITEM C |
3 |
3 |
|
--ITEM F1 |
7 |
10(7+3) |
|
---ITEM G1 |
3 |
13(3+7+3) |
|
---ITEM G2 |
5 |
15(5+7+3) |
|
--ITEM F2 |
12 |
15(12+3) |
|
-ITEM D |
1 |
1 |
|
-ITEM E |
2 |
2 |
In the above example, if the master scheduler projects to make changes to the MPS 10 days in the future, then from the above table report the scheduler can identify the problem with Items G1, G2 and F2. All the transactions are displayed for the business unit, parent item and warehouse.
![]()